The CustomerOptix team is excited to share something we’ve been hard at work on: our brand new CX Summary Dashboard! Based on a ton of insightful feedback from our customers, it offers a simple yet powerful view of what needs attention and what’s working in your business’ customer experience, driving faster insights and value from our best-in-class mystery shopping service, tailored for small and mid-sized multi-location business operators.
Located in the ‘Dashboard’ area of your account portal and visible right when you login, our goal is to give you fast, actionable clarity on what your customers are experiencing across your locations and programs. Here’s how to read and use each section.
Quick Links:
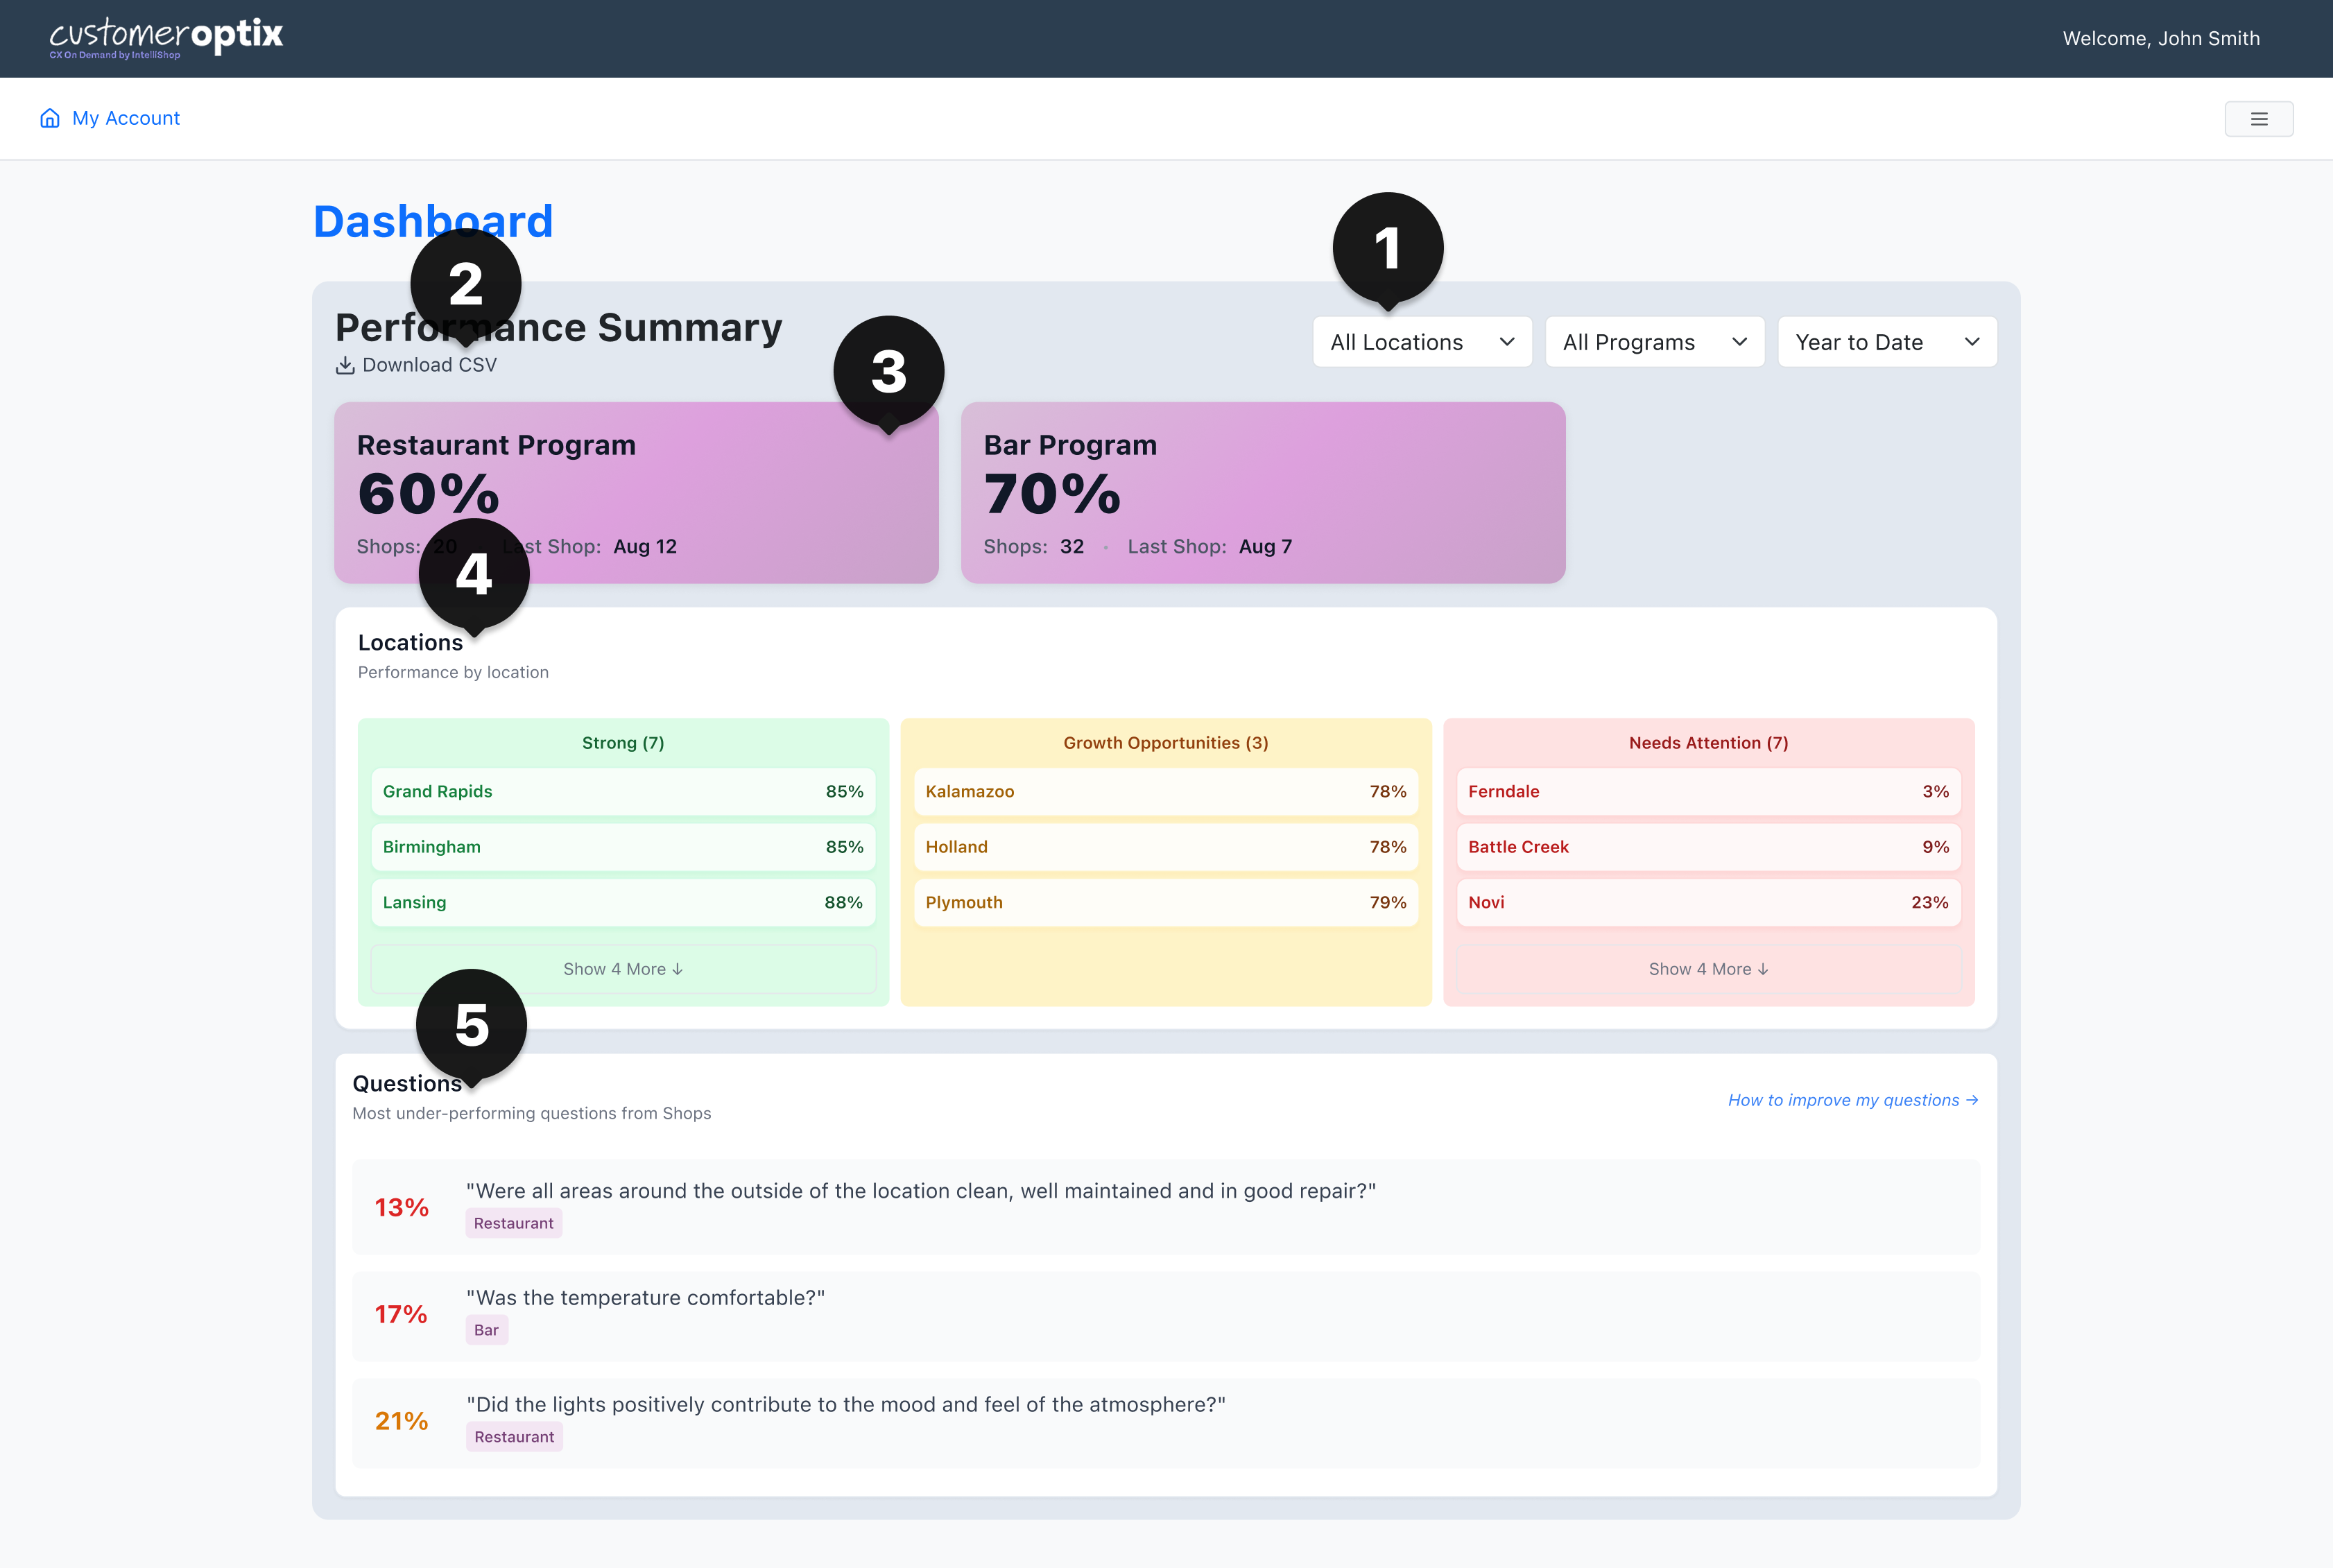
1. Filters
This is where you set the lens for the insights you want to see. You can filter the Dashboard by your Locations, your ongoing Programs, the Date Range, or any combination of these that you want to see.
Note that when you filter by Locations, Programs, or Date Range, all of the other sections of the dashboard will automatically update to reflect those filters, and the downloadable CSV files will also reflect the Date Range selected!
2. Download CSV Link
One-click export of all your Programs’ data within the specified Date Range filter. Easy!
3. Program Cards
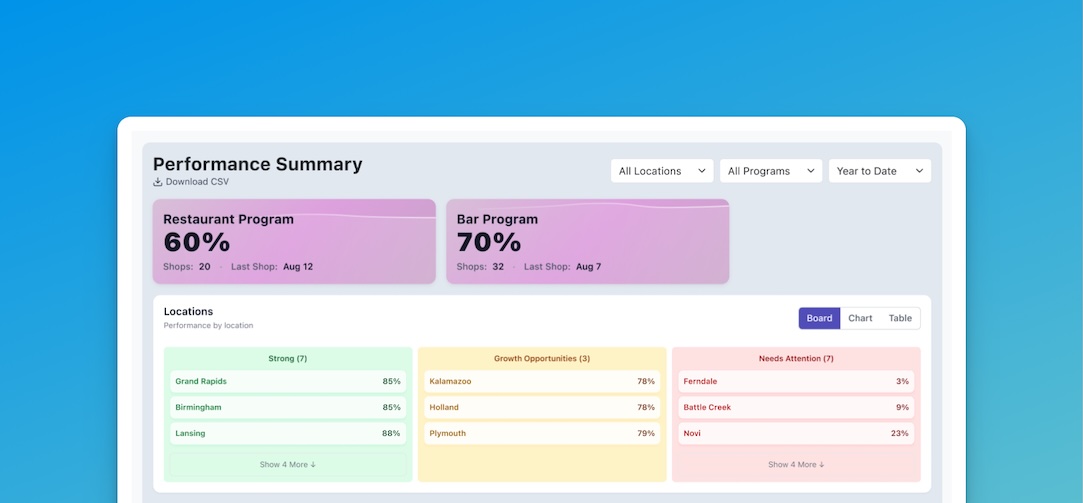
These cards give you a big-picture view of how each of your ongoing Programs is performing within the Date Range selected. (See the bottom of this section for a refresher on the definition of a Program*.)
- The percentage score you see in a Program Card is an average of the overall shop scores for all of your ongoing Programs of that type within the date range selected; so in the image above, if you had active Restaurant mystery shop programs running at seven locations, 60% would be the average of all of their overall scores within in the “year to date” time period that is selected in the upper right Date Range filter
- You can click or tap on the purple Program Cards to easily filter by that program type; the Location Board and Questions sections below will automatically update to filter by that Program type
PROGRAM CHART VIEW
Whenever you filter by Program, you’ll see a trended “sectional scores” over time for that Program.
%25402x.png)
Sectional scores correspond to the various “sections” of the mystery shop questionnaire used for the Program in question, and each section is comprised of multiple questions that ladder into the sectional score.
- Trends help you understand whether a problem is isolated or persistent and see your improvement over time
- This section is useful for coaching conversations with team members and managers: “Has this component of our customer experience improved over the past 3 months, or is it slipping?”
* With CustomerOptix, a Program is defined by three things: the mystery shop type; the questionnaire filled out by the shopper; and the weighting of the questions that make up the overall score.
Example: if you run weekly dine-in mystery shops at two different restaurants, call them Location A and Location B, using our standard Restaurant questionnaire, then both Location A’s and Location B’s scores would be aggregated into the “Restaurant” Program Card. The shop type is the same (dine-in), the questionnaire is the same (standard dine-in Restaurant questionnaire), and the weighting of the questions will be the same as they both use the same standard questionnaire.
Let’s now say you decided to make any of the following changes for, say, only Location A:
- Changed Location A’s shop type to take-out instead of dine-in
- Changed the questions in the questionnaire the mystery shopper fills out for Location A
- Changed the weighting of the questions in Location A’s overall score (this applies to custom questionnaires only, weighting cannot be changed on standard questionnaires)
Then, the two restaurants’ Programs would no longer be the same, and you would see a new Program Card appear in this section to reflect the creation of a new, different program for Location A.
4. Locations Board
The Location Board filters your locations by their overall performance scores within the Date Range selected. This view helps you compare locations side-by-side and quickly spot underperformers.
Note: if you filter by Program, the Location Board will automatically update to only show locations within that Program type. So, in the above example, if you chose to filter by Bar Programs, you would then only see locations that were running Bar Programs and locations running other Program types would be filtered out.
Locations are sorted into each performance section according to the following overall score brackets:
- Strong: 90% - 100%
- Growth Opportunity: 80% - 89%
- Needs Attention: 79% and below
5. Underperforming Questions
This section surfaces the lowest performing questions across all Programs, subject to your Program, Location, and Date Range filters.
This empowers you to see common pain points in your business and organization and use this as a “where to focus” list: e.g., if multiple locations are struggling with the same questions, that’s likely a systemic issue.
This new Summary Dashboard is designed to put critical insights at your fingertips and offer flexibility for further analysis through the exportable CSV files, and by offering trended and portfolio-level data, it’s the perfect complement to the individual CustomerOptix mystery shop reports you’ve come to know and love!
Have further questions? Feedback? Feature requests? Get in contact with us here!
Subscribe to the Buzz
Receive exclusive insights, tips, and customer experience strategies straight to your inbox.